
Anglesea River Estuary
A4 Coogoorah Park
Active Physico-Chemical Anglesea
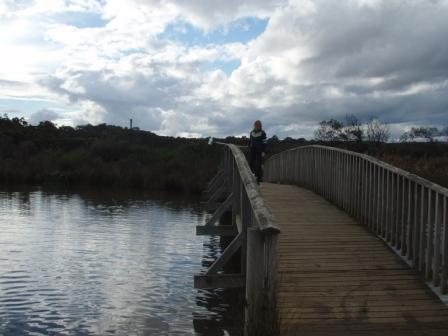
Footbridge located adjacent to Coogarah Park.
Head east along the footpath located adjacent to the Coogarah Park Carpark.
Land Use
- Native Bushland
- Recreational
Site information
Physical Chemical Tests
pH TopExplain for me 29-04-2007 to 21-10-2026
Median
6.5pH units Latest 3.6pH units pH BottomExplain for me 29-04-2007 to 21-10-2026
Median
6.4pH units Latest 3.6pH units |
Turbidity TopExplain for me 29-04-2007 to 21-10-2026
Median
9NTU Latest 98NTU Turbidity BottomExplain for me 29-04-2007 to 21-10-2026
Median
9NTU Latest 9NTU |
Water Temperature TopExplain for me 29-04-2007 to 21-10-2026
Median
16.1° C Latest 12.4° C Water Temperature BottomExplain for me 29-04-2007 to 21-10-2026
Median
18.5° C Latest 11.9° C |
Salinity TopExplain for me 29-04-2007 to 21-10-2026
Median
7.500ppt Latest 9.900ppt Salinity BottomExplain for me 29-04-2007 to 21-10-2026
Median
9.900ppt Latest 9.900ppt |
Dissolved Oxygen TopExplain for me 29-04-2007 to 21-10-2026
Median
8.51mg/L Latest 10.97mg/L Dissolved Oxygen BottomExplain for me 29-04-2007 to 21-10-2026
Median
8.33mg/L Latest 11.17mg/L |
Dissolved Oxygen Saturation TopExplain for me 29-04-2007 to 21-10-2026
Median
92.60% Latest 107.80% Dissolved Oxygen Saturation BottomExplain for me 29-04-2007 to 21-10-2026
Median
93.20% Latest 108.80% |
Conductivity TopExplain for me 29-04-2007 to 21-10-2026
Median
14.250mS/cm Latest 13.995mS/cm Conductivity BottomExplain for me 29-04-2007 to 21-10-2026
Median
17.136mS/cm Latest 14.555mS/cm |
Water quality indicators for riverine and lagoon estuaries
(2021 to 2026) 69 observations Explain for me| Year |
Surface water |
Bottom water |
||||||
|---|---|---|---|---|---|---|---|---|
| pH lower | pH upper | Turbidity | D.O. | pH lower | pH upper | Turbidity | D.O. | |
| pH | pH | NTU | % saturation | pH | pH | NTU | % saturation | |
| 25th percentile | 75th percentile | 75th percentile | 25th percentile | 25th percentile | 75th percentile | 75th percentile | 25th percentile | |
2021 to 2026 |
||||||||
2026 |
||||||||
2025 |
||||||||
2024 |
||||||||
2023 |
||||||||
2022 |
||||||||
2021 |
||||||||
We acknowledge and respect Victorian Traditional Owners as the original custodians of Victoria’s land and waters, their unique ability to care for Country and deep spiritual connection to it.
We honour Elders past and present whose knowledge and wisdom has ensured the continuation of culture and traditional practices.
We honour Elders past and present whose knowledge and wisdom has ensured the continuation of culture and traditional practices.
 All content, files, data and images provided by the EstuaryWatch Data Portal subject to a Creative Commons Attribution License
Data portal by CeRDI