H1 Site one (Hopkins River Bridge)
16 February 2024
Observation details
Overview
| Estuary | Hopkins River Estuary |
|---|---|
| Site | Site one (Hopkins River Bridge) |
| Observation ID | #16016 |
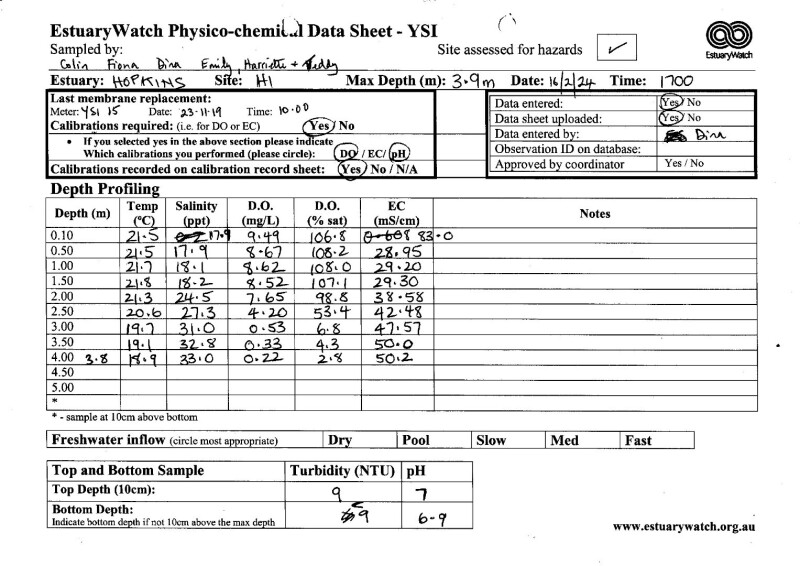
| Date and Time | Friday 16th February 2024 17:00pm |
| Approved | Approved |
Depth Profiling
| Depth m | Temperature °C | Salinity ppt | D.O. mg/L | D.O. % sat | EC mS/cm | Notes | |
|---|---|---|---|---|---|---|---|
| 0.1m | 21.50 | 17.90 | 9.49 | 106.8 | 28.95 | EC recorded as 83.0, ? misheard. No worries; I'm happy to use the 0.5m reading (J.Obst) | |
| Previous | 21.0 | 21.0 | 8.3 | 106.0 | 33.6 | ||
| Median | 17.2 | 13.00 | 9.24 | 99.60 | 21.6 | ||
| 0.5m | 21.50 | 17.90 | 8.67 | 108.2 | 28.95 | ||
| Previous | 21.3 | 20.9 | 7.5 | 95.4 | 33.3 | ||
| Median | 16.3 | 12.40 | 9.24 | 99.10 | 20.6 | ||
| 1.0m | 21.70 | 18.10 | 8.62 | 108.0 | 29.20 | ||
| Previous | 20.8 | 22.2 | 8.4 | 107.8 | 35.2 | ||
| Median | 15.9 | 28.50 | 8.26 | 97.00 | 43.9 | ||
| 1.5m | 21.80 | 18.20 | 8.52 | 107.1 | 29.30 | ||
| Previous | 20.5 | 21.3 | 6.2 | 79.0 | 33.9 | ||
| Median | 15.8 | 28.50 | 8.20 | 96.40 | 43.9 | ||
| 2.0m | 21.30 | 24.50 | 7.65 | 98.8 | 38.58 | ||
| Previous | 19.0 | 27.0 | 7.9 | 100.2 | 42.1 | ||
| Median | 16.0 | 31.50 | 7.65 | 89.60 | 48.4 | ||
| 2.5m | 20.60 | 27.30 | 4.20 | 53.4 | 42.48 | ||
| Previous | 19.6 | 23.4 | 3.4 | 43.4 | 36.9 | ||
| Median | 16.0 | 31.50 | 7.65 | 89.60 | 48.4 | ||
| 3.0m | 19.70 | 31.00 | 0.53 | 6.8 | 47.57 | ||
| Previous | 17.2 | 32.1 | 7.8 | 97.4 | 49.1 | ||
| Median | 15.9 | 32.10 | 7.25 | 86.10 | 49.1 | ||
| 3.5m | 19.10 | 32.80 | 0.33 | 4.3 | 50.00 | ||
| Previous | 19.2 | 24.8 | 1.1 | 13.6 | 38.9 | ||
| Median | 15.9 | 32.10 | 7.19 | 85.90 | 49.0 | ||
| 3.8m | 18.90 | 33.00 | 0.22 | 2.8 | 50.20 | ||
| Previous | 16.9 | 33.6 | 7.5 | 93.3 | 51.3 | ||
| Median | 15.9 | 32.20 | 7.25 | 86.10 | 49.1 |
We acknowledge and respect Victorian Traditional Owners as the original custodians of Victoria’s land and waters, their unique ability to care for Country and deep spiritual connection to it.
We honour Elders past and present whose knowledge and wisdom has ensured the continuation of culture and traditional practices.
We honour Elders past and present whose knowledge and wisdom has ensured the continuation of culture and traditional practices.
 All content, files, data and images provided by the EstuaryWatch Data Portal subject to a Creative Commons Attribution License
Data portal by CeRDI
All content, files, data and images provided by the EstuaryWatch Data Portal subject to a Creative Commons Attribution License
Data portal by CeRDI